

Table of Contents
Have you ever wished switching your entire dashboard from light to dark mode could be as easy as flipping a switch?
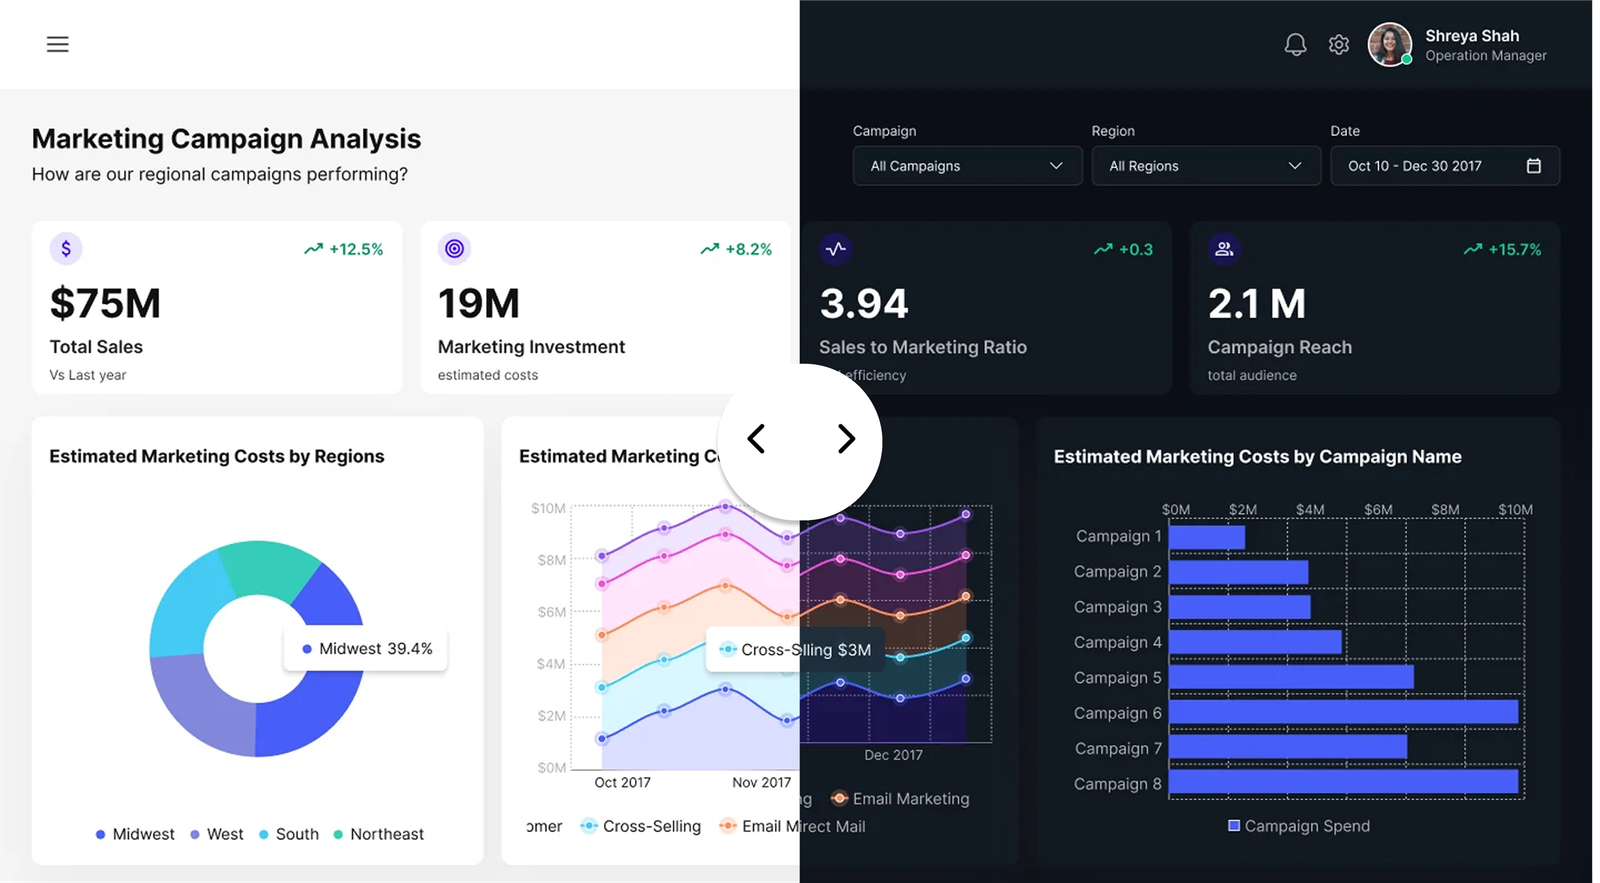
Well, now it is.
At PowerBIGraphs, we’ve engineered a powerful feature that brings modern theming to your data storytelling experience: One-Click Dark Mode. Whether you’re burning the midnight oil or presenting insights in a dim-lit boardroom, this feature ensures your visuals are always optimized for the moment.
The Magic Behind the Scenes: Tokens & Variables
So, how does it all work?
The answer lies in the design architecture we’ve built — powered by well-defined tokens and variables for every color, background, and visual element. Each design component pulls from a central style system using semantic tokens like:
–color-bg-primary
–color-text-muted--color-accent-main
These tokens act as the single source of truth. When you toggle between light and dark mode:
- Light tokens are swapped with dark variants
- Every chart, text, button, and widget instantly reflects the new style
- No manual restyling needed, ever
This isn’t just a design trick — it’s a deeply structured design system that brings scalability, performance, and consistency to your dashboards.
Why Dark Mode Isn’t Just a Trend
Dark mode has evolved beyond aesthetic preference. It’s a functional upgrade that serves real purposes:
🧠 Cognitive Ease
Dark mode reduces eye strain, especially during extended data analysis sessions. It helps your brain stay focused without fatigue.
🎨 Visual Pop
Charts and visual elements often stand out better in dark backgrounds, enhancing clarity and impact.
🌍 User Preference
A growing number of users default to dark mode on their devices. Meeting this expectation increases adoption and engagement.
Benefits for Data Creators & Teams
One-click theming isn’t just convenient — it empowers design flexibility at scale. Here’s how it benefits different users:
👩💼 Business Teams
Adapt dashboards to presentation environments (boardroom, remote, dark-themed apps)
Quickly rebrand for clients with consistent themes
🧑🎨 Designers
Avoid duplicate visual systems for light/dark variants
Save countless hours of manual style updates
🧑💻 Developers
Clean, modular code using token-based architecture
Easy integration and maintenance
Real Use Case: Before & After
Scenario: You’ve designed a beautiful quarterly report in PowerBIGraphs using your company’s brand colors. Suddenly, your manager asks,
“Can we present this in dark mode during the webinar?”
With traditional tools: You’d be stuck redoing visuals, adjusting charts, re-checking contrast, and realigning elements.
With PowerBIGraphs: One click. That’s it.
✔️ The layout stays intact
✔️ Branding remains consistent
✔️ No visual bugs or regressions
Built for Scalability and Future-Proofing
This one-click dark mode isn’t just a feature — it’s a design philosophy. PowerBIGraphs is built with enterprise-grade flexibility, enabling:
Rapid visual theming for multiple clients
Automatic responsiveness to system-level preferences
Support for accessibility guidelines (e.g., contrast ratio compliance)
You don’t need to be a developer to love it — but if you are, you’ll appreciate how smart and scalable it is.
Your Design System, Evolved
In a world where user preferences, brand themes, and presentation contexts shift rapidly, your data tools need to be as flexible as your workflow.
PowerBIGraphs gives you that edge — with a one-click dark mode that’s:
Technically robust
Visually consistent
Incredibly intuitive
Ready to Try It?
Experience it yourself and transform your dashboard game.
👉 Visit PowerBIGraphs.com
🎁 Plus: Get early access to our Mobile UI Kit and a Complimentary Dashboard Pack this week only.
