

Table of Contents
In today’s fast-paced business environment, data is everywhere sales numbers, customer interactions, marketing metrics, supply chain updates, and more. But raw data alone isn’t enough. Without the right visualization, dashboards can become overwhelming, underused, or ignored entirely.
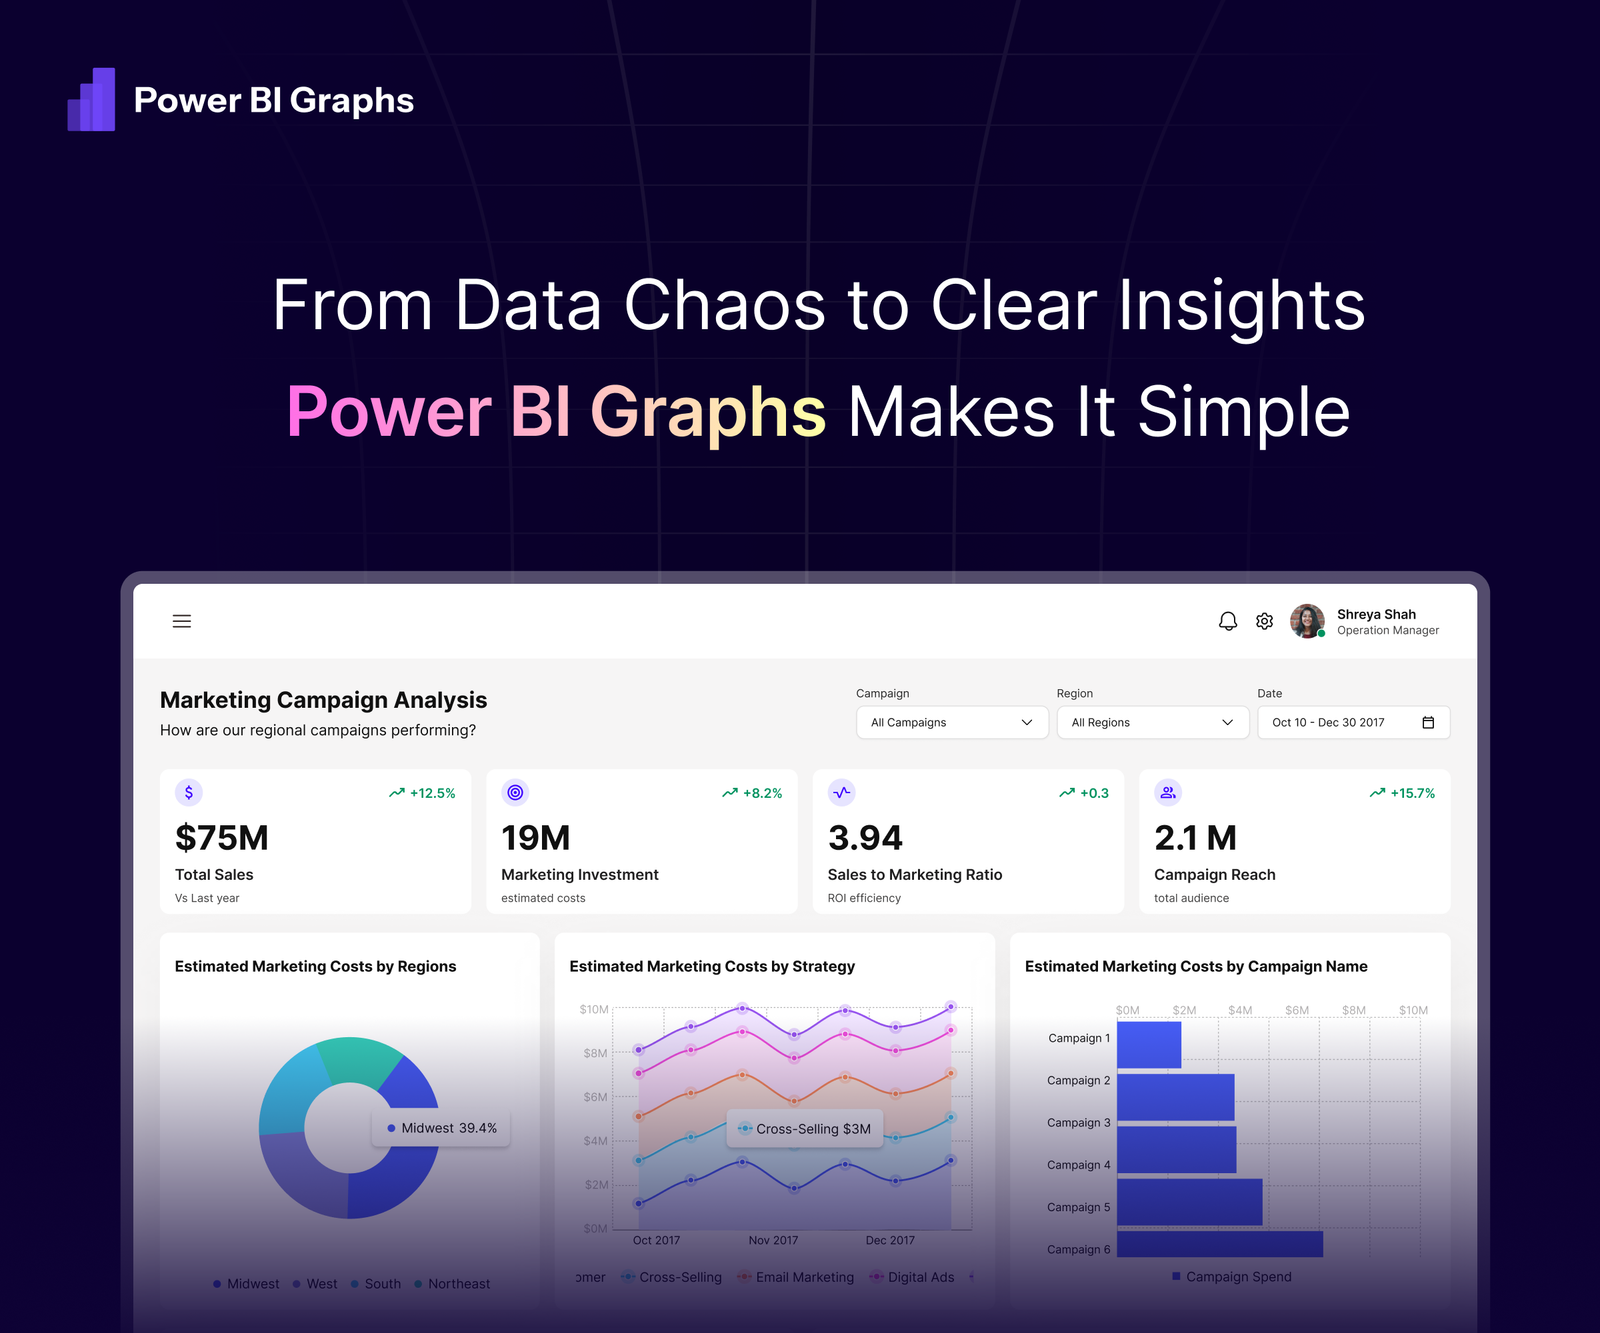
Microsoft Power BI provides a robust analytics platform, but many dashboards still suffer from generic visuals, cluttered layouts, and limited adoption. That’s where Power BI Graphs comes in. We transform standard Power BI dashboards into branded, interactive, and actionable insights that empower teams across your organization.
With Power BI Graphs, your business moves from data chaos → clarity, making decisions faster, easier, and more accurate.
Why Power BI Graphs Is a Game-Changer
1. Modern, Branded Dashboards
Standard Power BI visuals often feel functional but uninspiring. Power BI Graphs provides Figma-designed UI templates that:
- Match your corporate branding
- Make dashboards visually engaging
- Encourage adoption and usage across teams
Example: Finance dashboards with branded color palettes and KPI tiles that highlight revenue trends instantly.
2. Mobile-First Design
With over 60% of managers checking dashboards on mobile, a responsive, touch-friendly layout is essential. Power BI Graphs ensures:
- Interactive charts optimized for mobile screens
- Easy navigation and filtering
- Consistent performance across devices
3. Custom KPIs for Every Industry
Healthcare, retail, finance, or logistics every business needs different metrics. Power BI Graphs lets you:
- Tailor dashboards to industry-specific KPIs
- Build dashboards for strategic, operational, or tactical use cases
- Ensure insights are meaningful and actionable
4. Real-Time Insights Without Clutter
Stop wasting time digging through irrelevant data. With Power BI Graphs, dashboards:
- Highlight the most important metrics first
- Include interactive filters and drill-downs
- Refresh automatically for real-time, accurate insights
Benefits Across Your Organization
- Executives & Leaders: Spot trends, monitor performance, and make fast, informed decisions.
- Analysts: Build predictive models, conduct advanced analysis, and share interactive reports effortlessly.
- Teams & Departments: Collaborate in real time, reduce back-and-forth emails, and ensure everyone has the same data context.
Getting Started in Four Steps
- Define Key Metrics – Identify the KPIs that matter most to your business.
- Prepare & Connect Data – Clean and unify data sources in Power BI for accurate reporting.
- Design Branded Dashboards – Use Power BI Graphs templates to create engaging, intuitive visuals.
- Publish & Automate – Schedule refreshes, secure sharing, and real-time updates for every user.
Best Practices for Maximum Impact
- Tell a Story with Data: Combine charts and graphs with concise narratives to make insights easier to understand.
- Use AI Features in Power BI: Predictive analytics and natural language queries accelerate decision-making.
- Promote Adoption Across Teams: Branded, interactive dashboards encourage usage and foster a data-driven culture.
Why Choose PowerBIGraphs?
At PowerBIGraphs, we specialize in taking Power BI dashboards beyond the basics. Our approach combines:
UI Kits for Power BI (desktop & mobile) – for faster, consistent design
Industry-specific expertise – layouts and visualizations tailored to your sector
Custom design services – dashboards built around your KPIs and workflows
Scalable solutions – dashboards that grow with your business
Whether you’re in retail, finance, healthcare, logistics, or e-commerce, we design dashboards that deliver insights clearly and beautifully.
Conclusion
Your dashboards aren’t just reports they are decision-making engines. Generic, cluttered dashboards reduce adoption, slow decisions, and obscure opportunities.
With Power BI Graphs, you transform Microsoft Power BI dashboards from clutter → clarity, generic → branded, and passive → actionable.
Take the next step to empower your business
- Explore Our Figma UI Kit – Pre-built templates for desktop and mobile dashboards.
- Book a Dashboard Makeover Call – Custom solutions for your business and industry.
- See Mobile Dashboard Solutions – Touch-friendly dashboards for managers on the go.
Power BI Graphs: Turning Microsoft Power BI dashboards into business growth engines
