

Table of Contents
Why Generic Dashboards Don’t Work Anymore
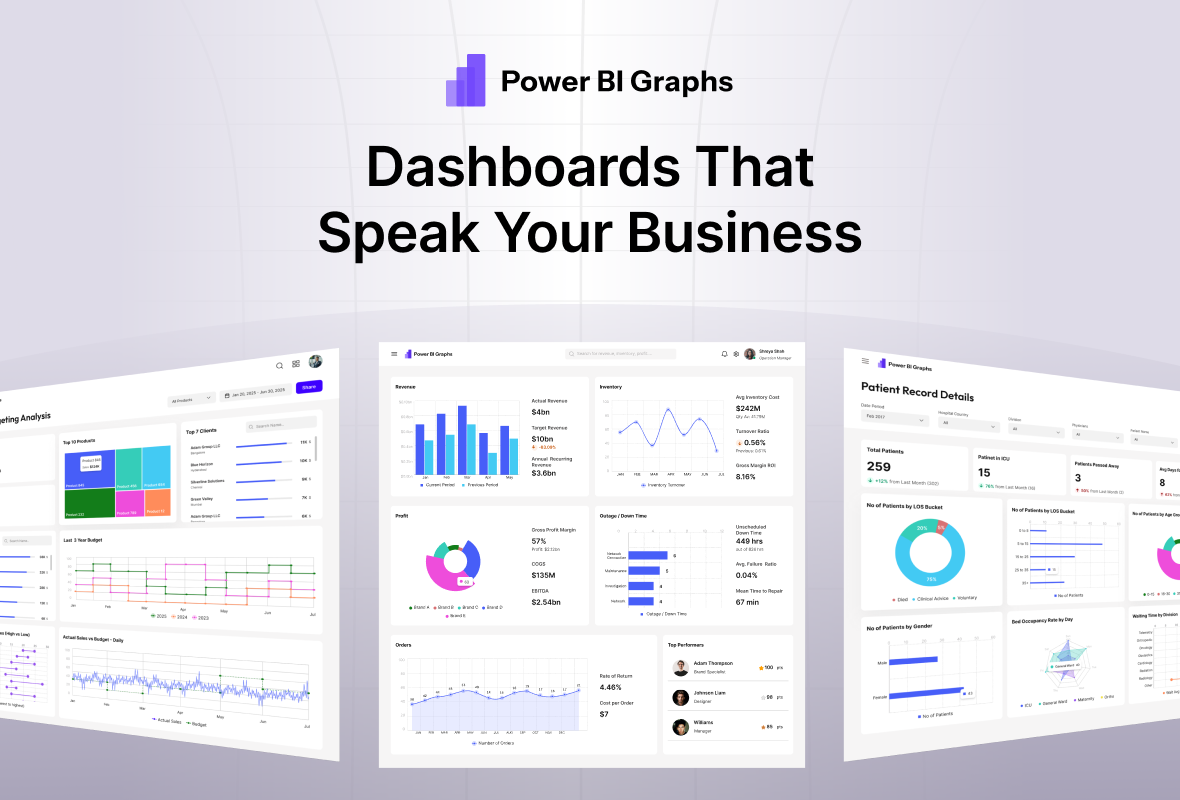
Most dashboards today are built using the same layout, same charts, and same visual patterns — regardless of whether the business is SaaS, Finance, HR, Marketing, or Operations.
But here’s the truth:
A generic dashboard can only show data.
An industry-specific dashboard tells a story.
That’s why PowerBI Graphs V2 includes industry-specific dashboard templates designed for the KPIs, workflows, and decision patterns unique to each business domain.
Instead of forcing teams to start from scratch, V2 lets you design dashboards that already “speak the language” of your business.
Why Generic Dashboards Fail
Generic dashboards fail because they ignore context.
Most teams struggle with:
Irrelevant KPIs
Poor information hierarchy
Generic layouts that don’t match business roles
Extra noise and complex navigation
Data points that don’t support real decision-making
This leads to frustration:
“This dashboard looks good, but it’s not actionable.”
“It doesn’t tell me what I need to know.”
PowerBI Graphs V2 solves this by aligning dashboard design with industry logic.
What It Means to Design Industry-Specific Dashboards
1. Industry-Specific Metrics
Every domain has its own KPIs:
SaaS → MRR, ARR, Churn, Activation
Finance → P&L, Variance, Margins
HR → Hiring Pipeline, Headcount, Attrition
Marketing → ROAS, CAC, Funnels, Engagement
Operations → Capacity, Inventory, Fulfillment
V2 templates start with these KPIs baked in.
2. Storytelling Made for Each Business Role
Each business function uses dashboards differently.
CMOs need funnels + performance
CFOs need ratios + tables
HR teams need trends + segmentation
Ops need real-time metrics
V2 templates follow the decision-making flow of each role.
3. Layouts Designed Around Real KPIs
Instead of forcing universal layouts, PowerBI Graphs V2 uses domain-aligned structures:
SaaS → Revenue → Growth → Cohorts → Retention
Finance → P&L → Expenses → Margin → Forecast
HR → Hiring → Attrition → Headcount → DEI
Marketing → Traffic → Costs → Performance → ROAS
Design that feels intuitive → Insights understood faster.
What’s Included in PowerBI Graphs V2 (Industry Templates)
1. SaaS Performance Dashboard
Includes:
MRR Breakdown
Net Revenue Retention
Activations & Engagement
Churn Segments
Cohort Analysis
2. Finance & Profitability Dashboard
Includes:
P&L Overview
Variance Heatmaps
Cost Centers
Forecast Curves
Cash Flow Trends
3. HR & People Analytics Dashboard
Includes:
Headcount
Hiring Pipeline
Attrition Analysis
Performance Distribution
Diversity & Inclusion Metrics
4. Marketing Insights Dashboard
Includes:
ROAS by Channel
CAC Trends
Funnel Analysis
Campaign Performance
Engagement Metrics
5. Operations & Inventory Dashboard
Includes:
Capacity Utilization
Inventory Levels
Fulfillment Metrics
Delays & Exceptions
Throughput Trends
Why Industry Dashboards Save Weeks of Work
✔ No blank screens
✔ KPIs matched to business needs
✔ Faster approvals from stakeholders
✔ Clearer insight storytelling
✔ Cleaner developer handoff
✔ A consistent dashboard system across teams
Teams don’t just “see data” —
they understand it instantly.
Final Thought
Dashboards become powerful when they match the language of the business.
That’s why PowerBI Graphs V2 goes beyond generic UI kits and gives you industry-ready layouts that fit the real world.
👉 Design dashboards that speak your business language → https://powerbigraphs.com
