

Table of Contents
🌙 Dark Mode Is No Longer Optional
Dark mode is no longer a “nice-to-have” feature.
For modern dashboards, it’s a baseline expectation.
Executives review dashboards in low-light environments.
Developers and analysts work long hours.
Operations teams monitor metrics on large screens.
Yet most dashboards struggle with dark mode:
-
Poor contrast
-
Hard-to-read text
-
Broken charts
-
Inconsistent colors
-
Manual rework for every component
PowerBI Graphs V2 solves this with a true dark mode system, not a cosmetic overlay.
🔥 Why Dark Mode Fails in Most Dashboards
Dark mode often fails because it’s treated as an afterthought.
Common issues:
-
Colors inverted manually
-
Charts losing clarity
-
Accent colors becoming too harsh
-
Text readability suffering
-
Components styled inconsistently
This leads to:
“The dark version doesn’t look right.”
“Can we just stick to light mode?”
With PowerBI Graphs V2, dark mode is engineered, not patched.
🌗 How Dark Mode Works in PowerBI Graphs V2
Dark mode in V2 is powered by Figma Variables and design tokens, not duplicated components.
Instead of recoloring manually, we built:
-
Semantic background tokens
-
Contrast-safe text tokens
-
Accent colors optimized for dark surfaces
-
Chart palettes designed for dark contexts
So switching themes updates everything automatically.
🎨 Light & Dark Themes — Built as First-Class Citizens
Light Theme Includes
-
Clean surface backgrounds
-
Soft shadows
-
Dark text for clarity
-
Muted chart grids
-
Balanced accent colors
Dark Theme Includes
-
Deep surface layers
-
High-contrast text
-
Reduced glare
-
Optimized chart colors
-
Subtle elevation instead of heavy shadows
Both themes are designed with equal priority.
📊 Dark Mode That Works for Charts
Charts are where dark mode usually breaks.
PowerBI Graphs V2 ensures:
-
Axis labels remain readable
-
Grid lines stay subtle
-
Data colors pop without overwhelming
-
KPIs remain clear and scannable
-
Heatmaps and cohorts retain meaning
Every visual component is tested in both modes.
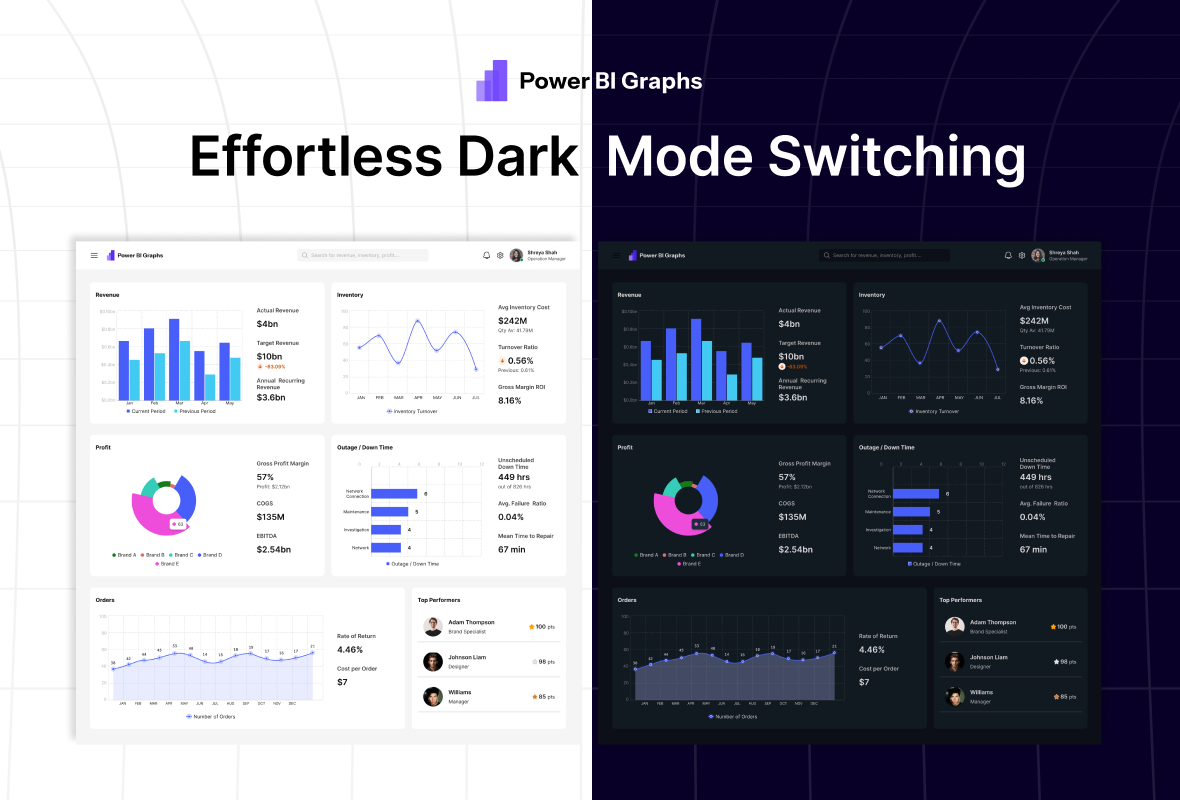
⚡ One-Click Theme Switching
Here’s the real advantage:
You don’t redesign dashboards for dark mode.
You switch modes.
With one variable toggle:
-
Entire dashboards update
-
All components adapt
-
Charts, cards, text, and icons remain consistent
No duplicated files.
No manual overrides.
💡 Why This Matters for BI Teams
✔ Better usability
Dark dashboards reduce eye strain during long analysis sessions.
✔ Executive-ready presentations
Preview dashboards in light or dark instantly.
✔ Brand adaptability
Dark mode works seamlessly with brand color systems.
✔ Faster design workflow
No rework. No manual fixes.
✔ Future-proof system
Scales with new themes and branding needs.
🚀 Final Thought
Dark mode done wrong creates friction.
Dark mode done right creates confidence.
PowerBI Graphs V2 treats dark mode as a core design system feature, not an afterthought — giving teams the flexibility to design once and present anywhere.
👉 Experience effortless theme switching → https://powerbigraphs.com
