

Table of Contents
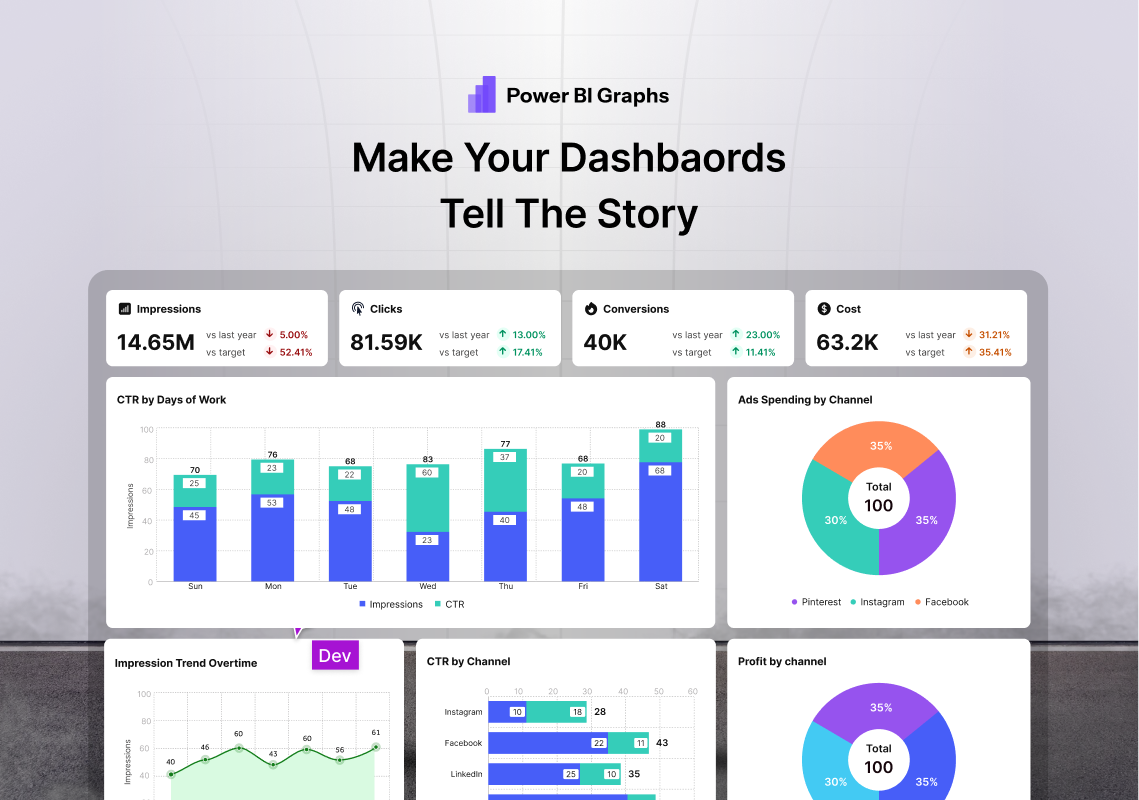
Dashboards Should Tell a Story, Not Just Show Data
Most dashboards fail for one simple reason:
They show numbers — but they don’t explain what those numbers mean.
Stakeholders open dashboards and see charts, tables, and KPIs everywhere.
But without structure, they still ask questions like:
• What changed this month?
• What should I focus on first?
• Why is this metric important?
• What action should we take?
A good dashboard answers these questions automatically.
That’s where dashboard storytelling comes in.
PowerBI Graphs V2 is designed to help teams transform raw metrics into clear, decision-ready narratives.
Why Dashboard Storytelling Matters
Executives don’t have time to interpret complex charts.
They need dashboards that immediately answer:
What happened?
Why did it happen?
What should we do next?
When dashboards lack storytelling, users experience:
• Information overload
• Confusing visual hierarchy
• Too many competing KPIs
• Slow decision-making
Story-driven dashboards eliminate that confusion.
The 4 Layers of Dashboard Storytelling
1. Start with the Big Picture
Every dashboard should begin with high-level KPIs.
These answer the question:
“Is the business moving in the right direction?”
Examples:
• Revenue / Profit
• Total Users
• Total Passengers
• Total Orders
• Overall Performance Index
PowerBI Graphs V2 includes clean KPI cards designed specifically for executive scanning.
2. Show the Trends Behind the Numbers
Once users see the headline numbers, they naturally ask:
“Why did this change?”
Trend charts answer this question.
Examples:
• Monthly growth
• Performance trends
• Customer behavior patterns
• Operational efficiency changes
V2 uses structured trend blocks so these visuals always appear directly after the KPIs.
3. Provide Context & Comparisons
Numbers mean nothing without comparison.
That’s why dashboards should always include:
• Previous period comparisons
• Budget vs actual
• Forecast vs reality
• Target vs performance
PowerBI Graphs V2 builds these comparisons directly into KPI components.
Users instantly see whether performance is improving or declining.
4. Guide the User to the Details
After understanding the big picture, users want to explore deeper insights.
This is where detailed charts help:
• Category breakdowns
• Regional performance
• Channel analysis
• Segment comparisons
These visuals sit below the primary story layers, ensuring dashboards remain clean and easy to navigate.
How PowerBI Graphs V2 Enables Story-Driven Dashboards
PowerBI Graphs V2 was built around a structured storytelling layout.
Instead of random chart placement, dashboards follow a logical hierarchy:
↓
Performance Trends
↓
Comparisons & Forecasts
↓
Operational Breakdowns
This structure helps stakeholders understand insights in seconds.
The Result: Faster Decisions
When dashboards follow a clear narrative structure:
✔ Stakeholders understand metrics instantly
✔ Analysts spend less time explaining charts
✔ Executives identify trends faster
✔ Teams make better decisions
Dashboards stop being “data reports” and become decision tools.
What This Means for BI Teams
With PowerBI Graphs V2 you can:
✔ Design story-driven dashboards faster
✔ Organize KPIs with clear hierarchy
✔ Present insights executives actually understand
✔ Reduce visual noise in complex dashboards
✔ Create consistent reporting across teams
Storytelling turns dashboards into business intelligence, not just visualization.
Final Thought
Data alone doesn’t drive decisions.
Understanding does.
The best dashboards don’t overwhelm users with numbers —
they guide them through the story behind those numbers.
PowerBI Graphs V2 helps teams build dashboards that communicate clearly, instantly, and effectively.
👉 Explore the design system → https://powerbigraphs.com
