

Table of Contents
The Future of Dashboard Design Is Variable-Driven
When we started building PowerBI Graphs V2, we set ourselves a challenge:
How can we let designers switch an entire dashboard from Light Mode to Dark Mode instantly —
without touching individual components, colors, or styles?
The answer: Figma Variables.
And this one feature is what transformed PowerBI Graphs V2 from a UI kit → into a true design system.
Why Figma Variables Matter for Dashboard Designers
Dashboards are complex.
They include dozens of elements:
Background layers
Cards
Grids
KPI tiles
Chart elements (bars, strokes, fills, labels)
Icons
Typography
Borders & separators
Changing a theme manually takes hours.
Changing it consistently takes days.
And maintaining it across multiple dashboards takes forever.
With variables, everything changes.
🌗 One-Click Theme Switching: How It Works
In PowerBI Graphs V2, we built a complete Dual Theme System powered by:
1. Color Variables
We created two sets:
Theme.Light
Theme.Dark
Each has definitions for:
Surface backgrounds
Accent colors
Data visualization colors
Text colors
Border & shadow tokens
Switching theme = switching variable mode.
Figma automatically updates components, charts, cards, AND entire dashboards.2. Typography Variables
We assigned typography roles as variables too:
Font.HeadingFont.BodyFont.MetricFont.Caption
This allows PowerBI Graphs V2 to adapt to:
Branding changes
Accessibility modes
Enterprise font standards
With zero manual edits.
3. Radius, Shadows & Spacing Tokens
Design consistency is not only color — it’s shape and depth too.
So we created variables for:
Radius.Small,Radius.Medium,Radius.LargeShadow.Level1,Shadow.Level2Spacing.8,Spacing.12,Spacing.16
Now, when the theme changes…
Card rounding updates
Depth/elevation adjusts
Chart spacing aligns automatically
This is real design system engineering, not just theming.
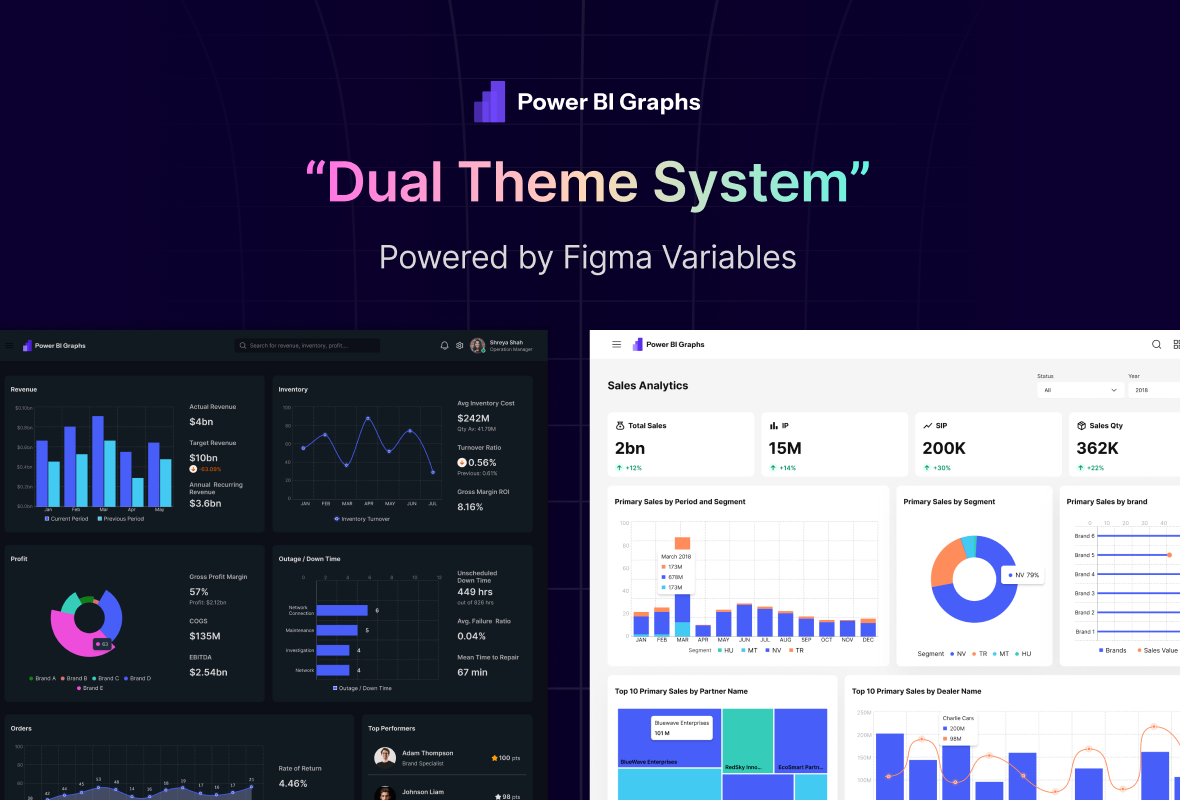
2. Dual Theme System: Light + Dark Mode in One Click
Data looks different in every environment — and now your design can too.
With Figma Variables, PowerBI Graphs V2 introduces a one-click theme switcher that instantly adapts every element from light to dark.
This isn’t a duplicated file — it’s a true variable-based theme that mirrors how Power BI itself handles theme JSONs.
Benefits:
Real-time theme previews
Automatic contrast adjustments for accessibility
Brand-specific color overrides with tokens
Unified palette:
#6030FF,#E83CFE,#1447E6,#FFA245,#FF8001
Why Dual Themes Are Critical for Power BI Projects
Most Power BI teams now work with both light and dark dashboards, depending on:
Client Branding
Presentation Environment
Developer Preference
Accessibility Needs
System UI Themes
PowerBI Graphs V2 solves 5 major problems:
| Problem | V2 Solution |
|---|---|
| Inconsistent themes | Variable-driven themes |
| Designers recolor components manually | Auto-theming with 1 click |
| Hard to collaborate with devs | Tokens align with Power BI JSON theme files |
| Slow prototyping | Drag-and-drop + instant styling |
| Hard to manage multiple clients | Brand tokens = 1-click brand override |
Real Example
Imagine this:
You design a full SaaS dashboard in Light Mode.
The client says:
“Can we preview this in dark theme?”
In a normal kit:
You redo 60+ components.
In PowerBI Graphs V2:
You click once.
Everything updates.
The Technical Architecture Behind It
Here’s a simplified view of how we structured the system:
Variables
 ├── Theme
 │     ├── Light
 │     └── Dark
 ├── Branding
 │     ├── Primary
 │     ├── Secondary
 │     ├── Accent
 ├── Typography
 │     ├── Heading
 │     ├── Body
 │     └── Metrics
 ├── Spacing
 ├── Radius
 └── Shadows
Every component in V2 references these variables.
So when a variable changes:
Dashboard templates
Components
Charts
Filters
Icons
Cards
…all update in real-time.
What This Means for You
1. 5× Faster Design Workflow
Your dashboard goes from idea → polished prototype in minutes, not hours.
2. Developer-Friendly Hand-Off
Variables act like design tokens → easy to hand over to Power BI developers.
3. Enterprise-Level Brand Consistency
Perfect for agencies managing multiple clients.
One token file = unlimited branded dashboards.
4. Scalable for Future Versions (V3 & V4)
Because variables = future-proof structure.
Final Thoughts
Dual themes are more than a “dark mode feature”.
They’re the foundation of how modern dashboards should be designed — scalable, consistent, and brand-adaptable.
With PowerBI Graphs V2, we’ve made this possible for every designer and BI team.
Design once. Theme infinitely.
That’s the power of Figma Variables + V2.
👉 Explore PowerBI Graphs V2 → https://powerbigraphs.com
