Start 2026 strong. Design and standardize Power BI visuals faster with fully
editable Figma templates, dual themes, and modern analytics layouts used by
leading data teams.
Key Highlights
✔️ Dual Light & Dark themes
✔️ 5+ industry-ready dashboards (Finance, Retail, Health & more)
Purpose-built Power BI dashboard templates designed for hospitals, clinics, and healthcare organizations to monitor performance, operations, and patient outcomes with clarity.
Most healthcare dashboards create confusion instead of clarity
Critical metrics buried inside complex tables
Patient volumes, bed occupancy, and emergency wait times hidden in dense spreadsheets make it impossible for healthcare teams to spot issues before they escalate.
Poor visibility into patient flow and resource utilization
Without clear visuals showing admissions, discharges, and department capacity, hospitals struggle to allocate staff and resources effectively.
Difficult comparison across departments and time periods
Comparing ER performance to surgery or tracking month-over-month trends requires manual work when data isn't structured for visual comparison.
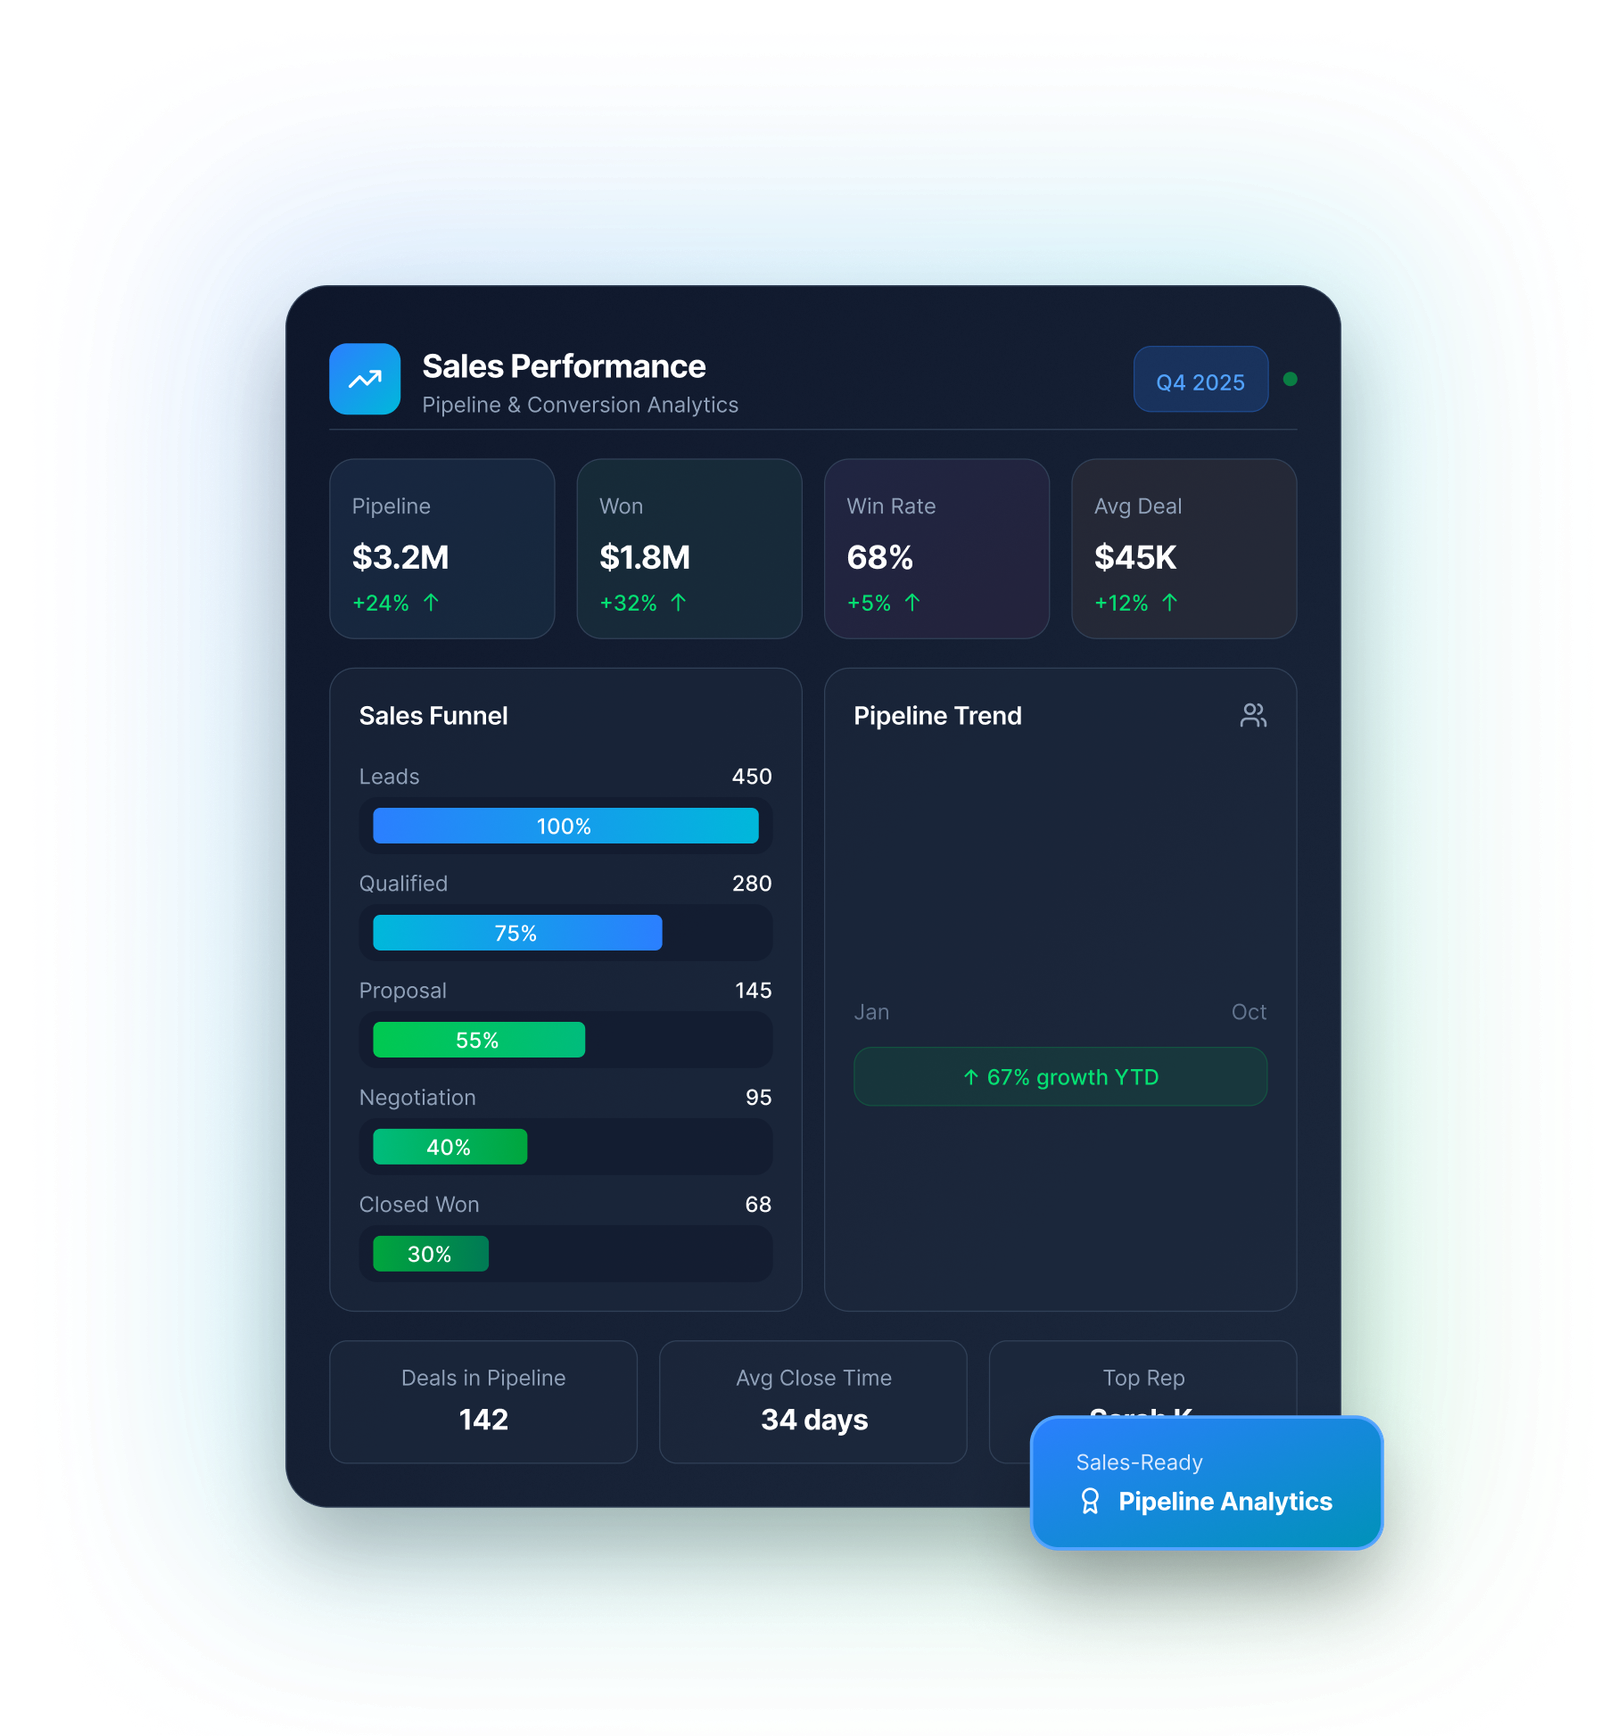
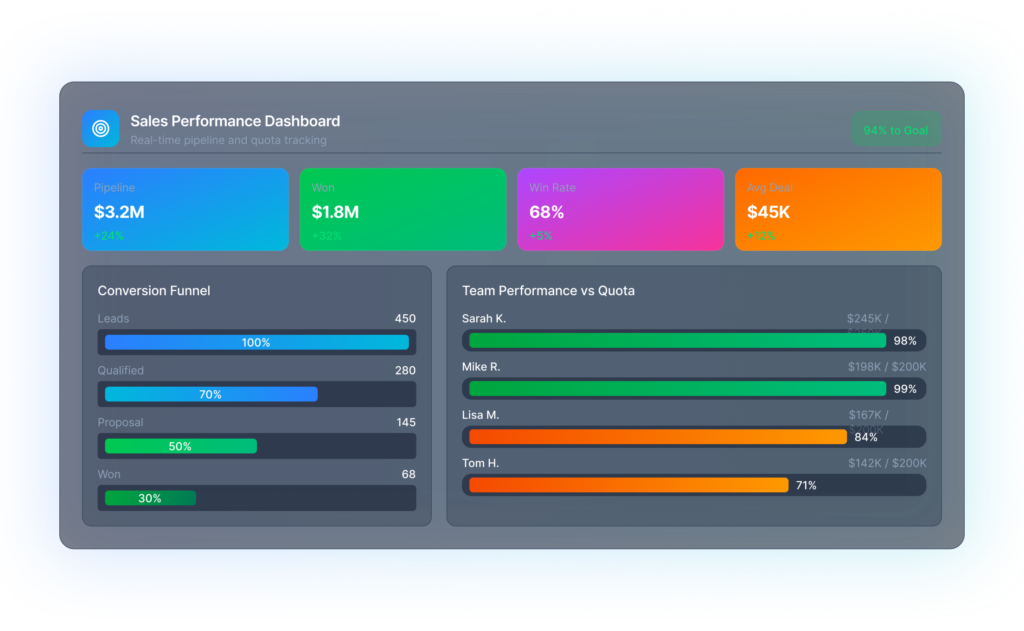
Sales Metrics
Included
Every KPI sales teams need to hit quota and optimize performance
Pipeline health
Total pipeline value, stage distribution, deal aging, velocity trends, coverage ratio
Conversion rates
Win rate, loss rate, stage-to-stage conversion, funnel drop-off analysis, deal probability
Deal velocity
Average sales cycle, time in each stage, deal acceleration trends, bottleneck identification
Make Sales Performance Actionable
Stop guessing. Start optimizing. Sales dashboards that show exactly where to focus your team's energy.