

Table of Contents
Speed Without Structure Creates Chaos
Designing BI dashboards often feels like a trade-off.
You can move fast —
but layouts break, spacing becomes inconsistent, and alignment falls apart.
Or you can design carefully —
but every resize, update, or new KPI takes time.
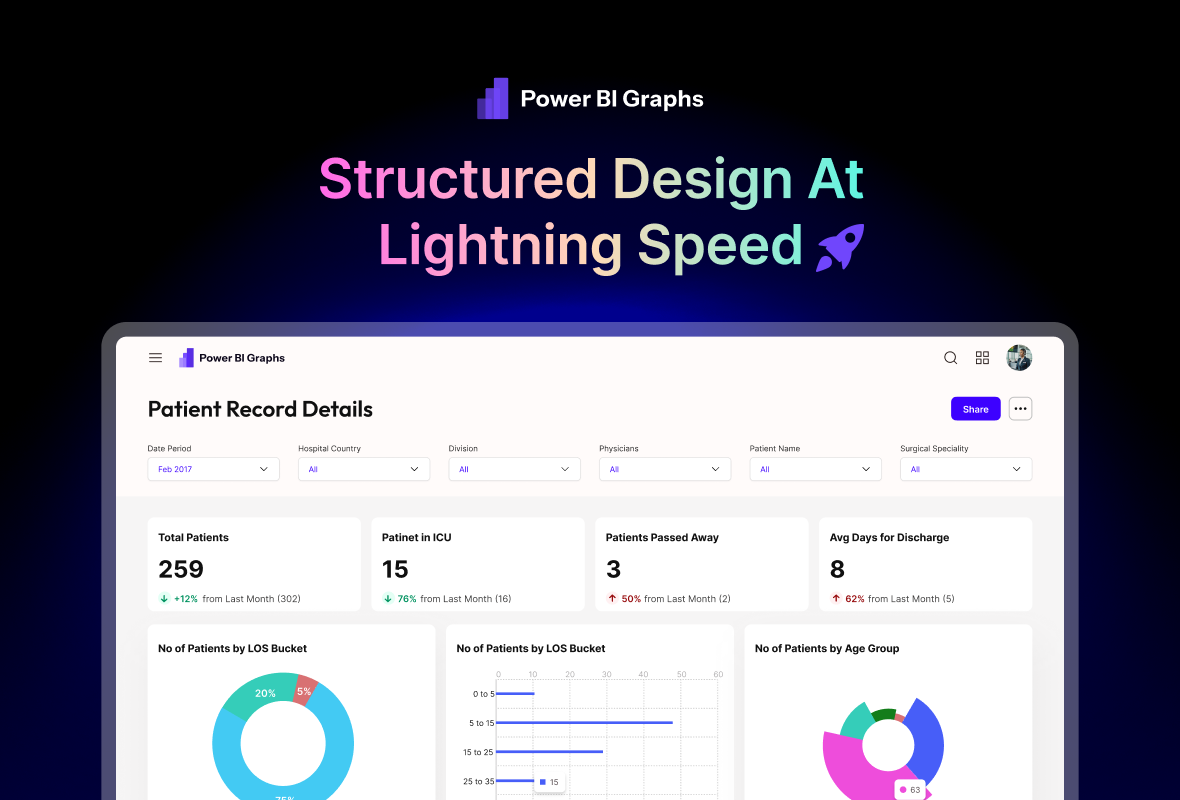
PowerBI Graphs V2 removes this trade-off by combining Auto-Layout 5.0 with a structured dashboard design system — so speed and structure work together, not against each other.
Why Dashboards Slow Designers Down
Dashboards are dense by nature:
-
Multiple KPIs
-
Tables and charts side-by-side
-
Filters, headers, and footers
-
Dynamic content sizes
-
Frequent stakeholder changes
Without a structural system, designers struggle with:
-
Manual spacing fixes
-
Broken alignments
-
Components overlapping
-
Inconsistent padding
-
Time wasted on resizing
Auto-Layout changes all of this — when used correctly.
What Auto-Layout 5.0 Brings to Dashboard Design
Auto-Layout 5.0 isn’t just about stacking elements.
It’s about responsive behavior, predictable spacing, and scalable layouts.
With Auto-Layout:
-
Components resize automatically
-
Spacing stays consistent
-
Layouts adapt to content changes
-
Dashboards scale without breaking
PowerBI Graphs V2 is built entirely on Auto-Layout — at every level.
Auto-Layout at Every Layer in PowerBI Graphs V2
1. Dashboard Containers
Each dashboard starts with structured containers:
-
Header
-
Filter bar
-
Content sections
-
Footer
When one section changes, the rest adapts automatically.
2. KPI & Card Components
KPI tiles use Auto-Layout so:
-
Numbers expand without overflow
-
Labels wrap correctly
-
Icons stay aligned
-
Spacing remains uniform
No manual resizing required.
3. Chart Blocks & Tables
Charts and tables:
-
Expand based on available space
-
Maintain padding rules
-
Stay aligned in grid layouts
-
Adjust gracefully across screen sizes
Perfect for complex BI views.
Designing in Minutes, Not Hours
Here’s what changes in real workflows:
Before (Manual Layouts):
-
Resize one card → fix 5 others
-
Add a KPI → adjust spacing everywhere
-
Change label length → realign text
With PowerBI Graphs V2:
-
Add or remove components
-
Resize sections freely
-
Let Auto-Layout handle the structure
The system does the heavy lifting.
Responsive by Design
Dashboards aren’t just desktop-only anymore.
Because Auto-Layout is built into V2:
-
Desktop layouts adapt to tablet
-
Tablet layouts adapt to mobile
-
Content stacks naturally
-
No duplicate designs required
This makes PowerBI Graphs V2 ideal for mobile-ready Power BI dashboards.
Why Structure Improves Design Quality
Speed is important — but structure is what makes dashboards usable.
Auto-Layout ensures:
-
Consistent visual rhythm
-
Predictable reading flow
-
Reduced cognitive load
-
Cleaner handoff to developers
When structure is handled by the system, designers can focus on insight and storytelling.
What This Means for BI Teams
✔ Faster prototyping
Build full dashboards in minutes.
✔ Fewer layout bugs
Spacing and alignment stay intact.
✔ Easier iteration
Changes don’t break designs.
✔ Better collaboration
Teams work from a shared structure.
✔ Scalable systems
Works across dozens of dashboards.
Final Thought
Speed without structure leads to fragile dashboards.
Structure without speed slows teams down.
PowerBI Graphs V2 delivers both — by pairing Auto-Layout 5.0 with a purpose-built BI design system.
Design faster.
Stay structured.
Scale with confidence.
👉 Start designing with PowerBI Graphs V2 → https://powerbigraphs.com
